How to Build a Coin Detail Overview Screen in Flutter (Full Code + Preview)
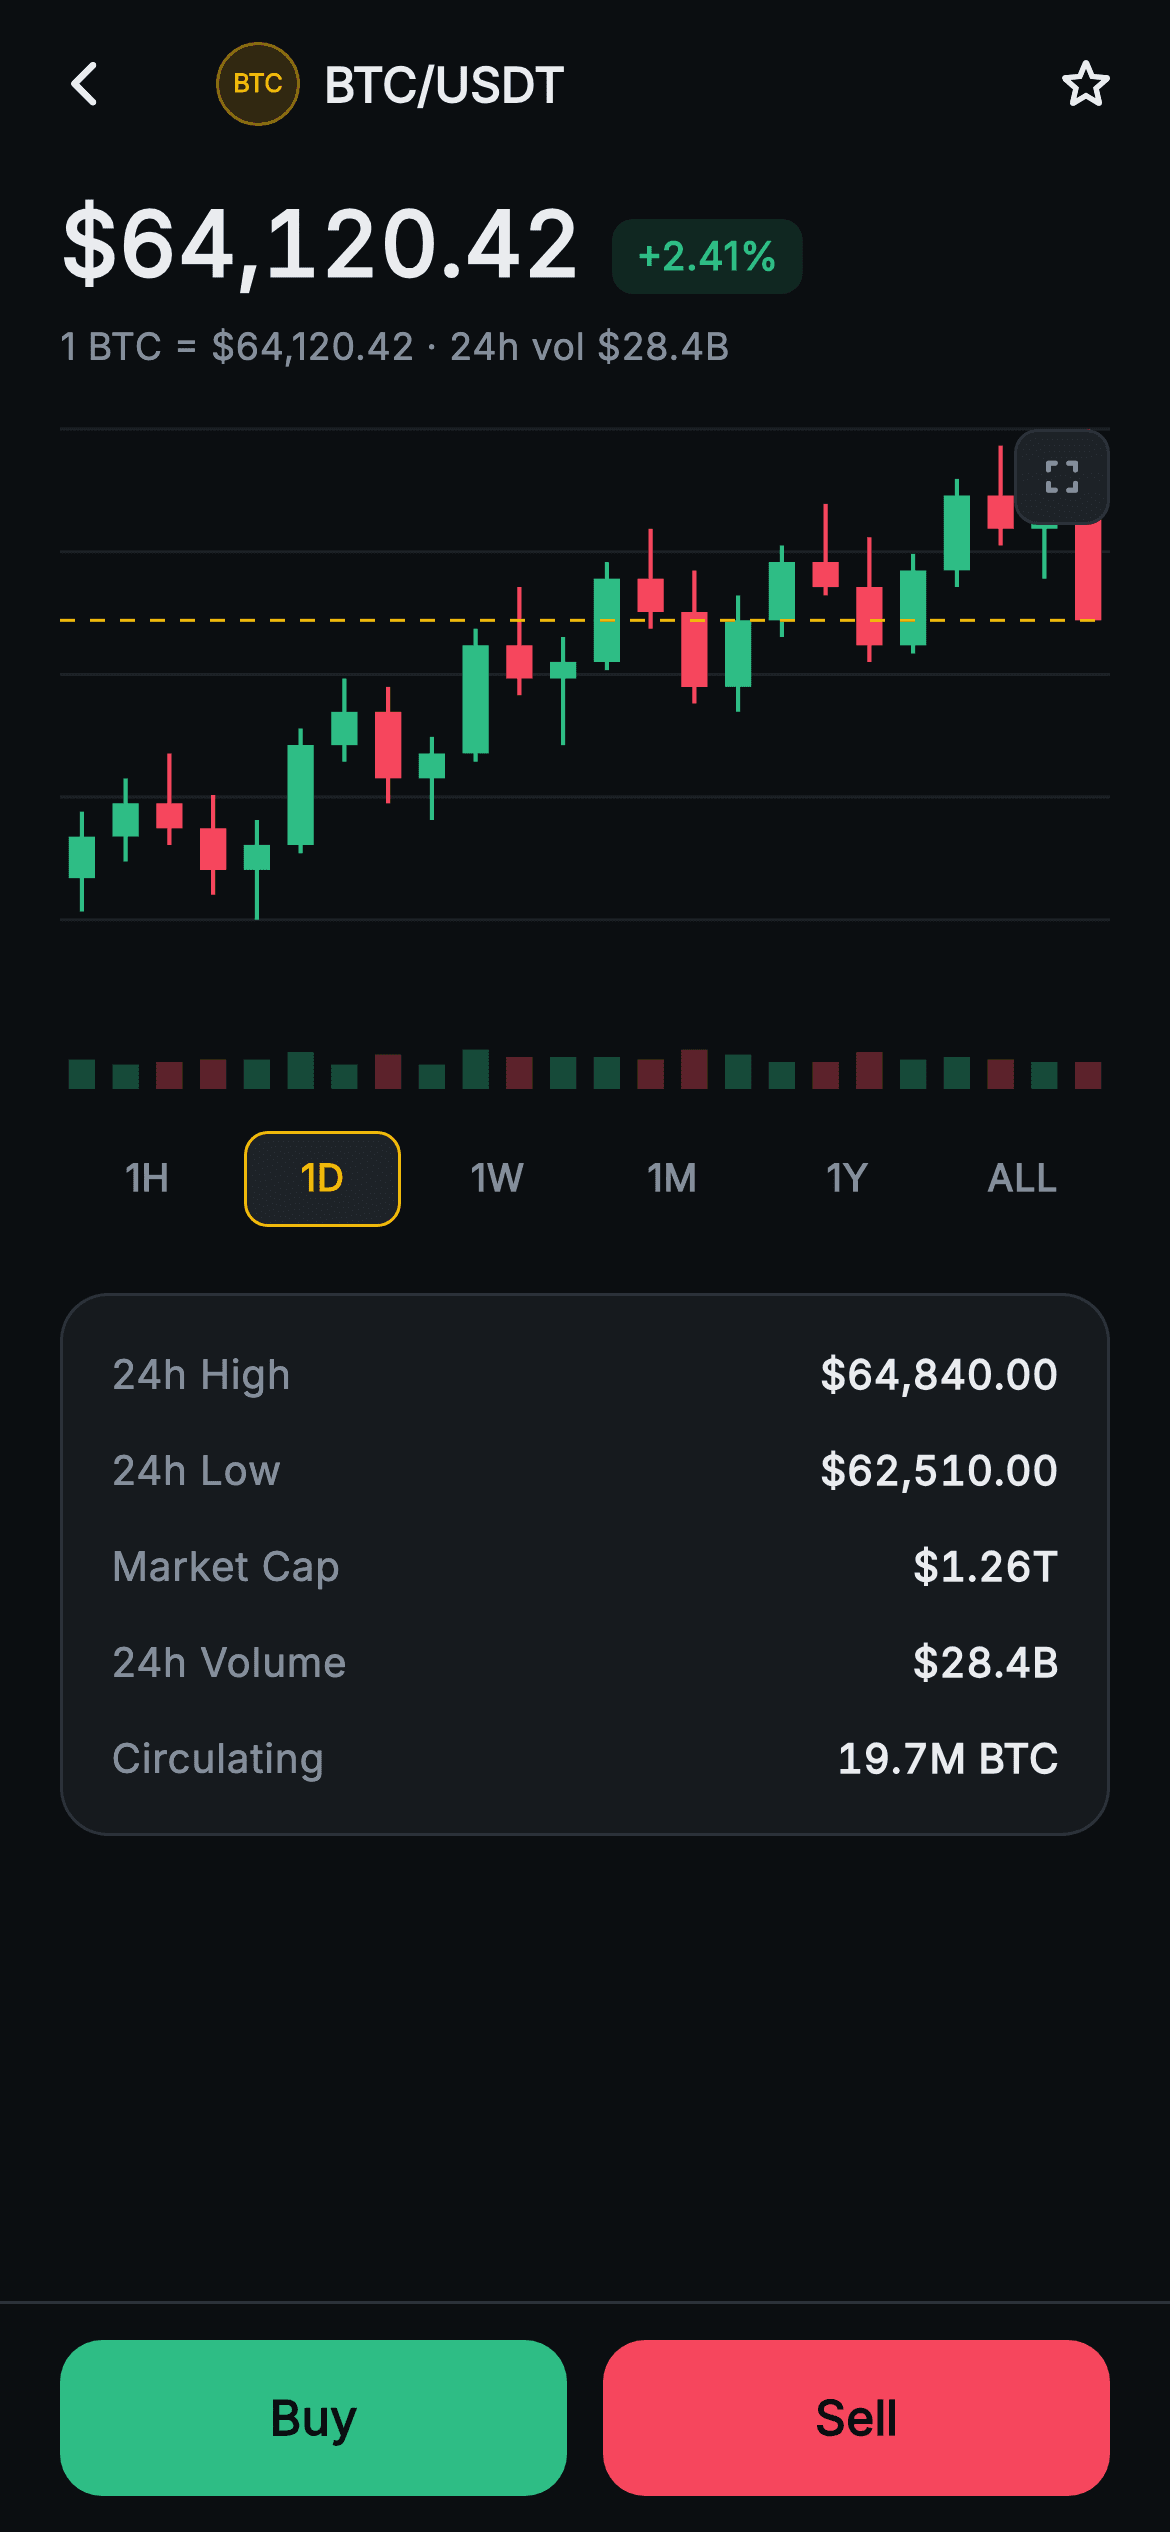
Every trading app lives or dies on its coin detail screen — the tab a user opens twenty times a day to check price, read the chart, and decide whether to trade. This tutorial walks through a Binance-style BTC/USDT overview built in pure Flutter: a 30px tabular-figure price with a green 24h pill, a candlestick chart drawn entirely by a CustomPainter, a six-way timeframe selector, a stats card, and a pinned Buy/Sell bar. You leave with one self-contained file, no charting package, ready to wire to a live feed.
What you'll build
- ✓A hand-painted OHLC candlestick chart with wicks, translucent volume bars, a four-quarter grid and a dashed gold last-price marker — no charting package
- ✓A gold ticker badge in the AppBar that truncates any ticker to three characters and pairs it with a BTC/USDT title
- ✓A 30px tabular-figure price beside a tinted +2.41% pill that never jitters as digits change
- ✓A six-frame timeframe row (1H–ALL) of equal-width pills toggled through one int of state
- ✓A pinned bottom bar with equal-weight green Buy and red Sell buttons over a safe-area-aware background
Step-by-step build
Create the file
Add a new file at lib/web3_coin_overview/web3_coin_overview_screen.dart in your Flutter project.
Register the bundled fonts
No external packages — this is pure Flutter. It does bundle its design font (Inter), so drop the font file into fonts/ and declare it in pubspec.yaml:
flutter:
  fonts:
    - family: Inter
      fonts:
- asset: fonts/Inter-Regular.ttfBuild it, piece by piece
Here's how the screen goes together. Each block below is a real slice of the code with a plain-English explanation — paste them in order, or grab the whole file from the next section.
A stateful widget with five exits and two defaults
import 'package:flutter/material.dart';

/// Web3 coin — Overview / detail. Ticker-badge header, live price with signed
/// 24h delta, a painted candlestick chart with volume bars + grid, timeframe
/// pills (1H–ALL), a stats grid, and a pinned buy/sell bar. Self-contained per
/// CONVENTIONS.md: pure Flutter, bundled Inter font, all graphics CustomPaint
/// (no glyphs / no network image), forced dark theme so it renders standalone.
class Web3CoinOverviewScreen extends StatefulWidget {
  const Web3CoinOverviewScreen({
    super.key,
    this.ticker = 'BTC',
    this.name = 'Bitcoin',
    this.onBack,
    this.onBuy,
    this.onSell,
    this.onFavorite,
    this.onFullscreen,
  });

  final String ticker;
  final String name;
  final VoidCallback? onBack;
  final VoidCallback? onBuy;
  final VoidCallback? onSell;
  final VoidCallback? onFavorite;
  final VoidCallback? onFullscreen;

  @override
  State<Web3CoinOverviewScreen> createState() => _Web3CoinOverviewScreenState();
}
Unlike a static error page, this screen is a `StatefulWidget` — the timeframe row genuinely mutates. The constructor takes `ticker` (default `'BTC'`) and `name` (default `'Bitcoin'`) plus five optional `VoidCallback`s: `onBack`, `onBuy`, `onSell`, `onFavorite`, `onFullscreen`. That signature is the integration contract — the widget never navigates or trades on its own, it just reports intent, so it drops into any router or backend. The `ticker` string threads through the whole screen: it fills the badge, the pair title and the unit-rate sub-line, which means passing `ticker: 'ETH'` re-labels everything in one place. `super.key` in the parameter list is the modern super-parameter syntax rather than `: super(key: key)`.
A Binance-flavoured palette and deterministic candles
class _Web3CoinOverviewScreenState extends State<Web3CoinOverviewScreen> {
  static const String _font = 'Inter';
  static const Color _bg = Color(0xFF0B0E11);
  static const Color _surface = Color(0xFF161A1E);
  static const Color _surfaceAlt = Color(0xFF1E2329);
  static const Color _brand = Color(0xFFF0B90B);
  static const Color _up = Color(0xFF2EBD85);
  static const Color _down = Color(0xFFF6465D);
  static const Color _text = Color(0xFFEAECEF);
  static const Color _muted = Color(0xFF848E9C);
  static const Color _hairline = Color(0xFF2B3139);

  static const List<String> _frames = <String>[
    '1H', '1D', '1W', '1M', '1Y', 'ALL',
  ];

  // Deterministic OHLC series (open, high, low, close), price units ~ $k.
  static const List<List<double>> _candles = <List<double>>[
    <double>[610, 618, 606, 615], <double>[615, 622, 612, 619],
    <double>[619, 625, 614, 616], <double>[616, 620, 608, 611],
    <double>[611, 617, 605, 614], <double>[614, 628, 613, 626],
    <double>[626, 634, 624, 630], <double>[630, 633, 619, 622],
    <double>[622, 627, 617, 625], <double>[625, 640, 624, 638],
    <double>[638, 645, 632, 634], <double>[634, 639, 626, 636],
    <double>[636, 648, 635, 646], <double>[646, 652, 640, 642],
    <double>[642, 647, 631, 633], <double>[633, 644, 630, 641],
    <double>[641, 650, 639, 648], <double>[648, 655, 644, 645],
    <double>[645, 651, 636, 638], <double>[638, 649, 637, 647],
    <double>[647, 658, 645, 656], <double>[656, 662, 650, 652],
    <double>[652, 657, 646, 655], <double>[655, 664, 653, 641],
  ];

  int _frame = 1;
The palette is ten `static const Color`s: near-black `#0B0E11` background, two raised surfaces (`#161A1E` and `#1E2329`), gold brand `#F0B90B`, and the pair every trader reads without thinking — `_up` green `#2EBD85` and `_down` red `#F6465D` — plus `#EAECEF` text, `#848E9C` muted and a `#2B3139` hairline. Keeping green and red for direction only, and gold for selection and markers, is what stops the screen turning into a fruit salad. `_candles` is 24 hard-coded `[open, high, low, close]` quads: deterministic data means the chart renders identically every build — no randomness in previews or golden tests — and each candle's close feeds the next candle's open so the series reads as a believable session. `_frame = 1` starts the selector on 1D, the frame most traders actually look at.
Forced dark theme and the ticker-badge AppBar
  @override
  Widget build(BuildContext context) {
    return Theme(
      data: ThemeData.dark(useMaterial3: true),
      child: Scaffold(
        backgroundColor: _bg,
        appBar: AppBar(
          backgroundColor: _bg,
          elevation: 0,
          leading: IconButton(
            onPressed: widget.onBack,
            icon: const Icon(Icons.arrow_back_ios_new_rounded,
                size: 18, color: _text),
          ),
          title: Row(
            mainAxisSize: MainAxisSize.min,
            children: <Widget>[
              Container(
                width: 28,
                height: 28,
                decoration: BoxDecoration(
                  color: _brand.withValues(alpha: 0.16),
                  shape: BoxShape.circle,
                  border: Border.all(color: _brand.withValues(alpha: 0.5)),
                ),
                alignment: Alignment.center,
                child: Text(
                  widget.ticker.length <= 3
                      ? widget.ticker
                      : widget.ticker.substring(0, 3),
                  style: const TextStyle(
                    fontFamily: _font,
                    fontSize: 8.5,
                    fontWeight: FontWeight.w700,
                    color: _brand,
                  ),
                ),
              ),
              const SizedBox(width: 8),
              Text(
                '${widget.ticker}/USDT',
                style: const TextStyle(
                  fontFamily: _font,
                  fontSize: 16,
                  fontWeight: FontWeight.w700,
                  color: _text,
                ),
              ),
            ],
          ),
          actions: <Widget>[
            IconButton(
              onPressed: widget.onFavorite,
              icon: const Icon(Icons.star_border_rounded,
                  size: 22, color: _text),
            ),
            const SizedBox(width: 4),
          ],
        ),
The whole tree is wrapped in `Theme(data: ThemeData.dark(useMaterial3: true))`, so the screen stays dark even inside a light-themed host app — a trading chart on a white background would be unreadable and off-brand. The AppBar title is a `MainAxisSize.min` Row: a 28px circular badge filled with `_brand.withValues(alpha: 0.16)` and ringed at alpha 0.5, holding the ticker at just 8.5px `w700` gold. The ternary `widget.ticker.length <= 3 ? widget.ticker : widget.ticker.substring(0, 3)` clamps long tickers like `MATIC` to three characters, because a 28px circle fits three glyphs at that size and no more. Next to it, `'${widget.ticker}/USDT'` names the actual market rather than just the asset. The trailing star `IconButton` wires to `onFavorite`, with a 4px SizedBox stopping it hugging the screen edge.
Price header and the chart Stack
        body: SafeArea(
          top: false,
          child: ListView(
            padding: const EdgeInsets.fromLTRB(20, 4, 20, 20),
            children: <Widget>[
              Row(
                crossAxisAlignment: CrossAxisAlignment.end,
                children: <Widget>[
                  const Text(
                    '\$64,120.42',
                    style: TextStyle(
                      fontFamily: _font,
                      fontSize: 30,
                      fontWeight: FontWeight.w800,
                      fontFeatures: <FontFeature>[FontFeature.tabularFigures()],
                      color: _text,
                    ),
                  ),
                  const SizedBox(width: 10),
                  Padding(
                    padding: const EdgeInsets.only(bottom: 5),
                    child: Container(
                      padding: const EdgeInsets.symmetric(
                          horizontal: 8, vertical: 3),
                      decoration: BoxDecoration(
                        color: _up.withValues(alpha: 0.14),
                        borderRadius: BorderRadius.circular(7),
                      ),
                      child: const Text(
                        '+2.41%',
                        style: TextStyle(
                          fontFamily: _font,
                          fontSize: 13,
                          fontWeight: FontWeight.w700,
                          color: _up,
                        ),
                      ),
                    ),
                  ),
                ],
              ),
              const SizedBox(height: 4),
              Text(
                '1 ${widget.ticker} = \$64,120.42 · 24h vol \$28.4B',
                style: const TextStyle(
                  fontFamily: _font,
                  fontSize: 12.5,
                  color: _muted,
                ),
              ),
              const SizedBox(height: 18),
              Stack(
                children: <Widget>[
                  SizedBox(
                    height: 220,
                    child: CustomPaint(
                      size: Size.infinite,
                      painter: _CandlePainter(candles: _candles),
                    ),
                  ),
                  Positioned(
                    top: 0,
                    right: 0,
                    child: GestureDetector(
                      onTap: widget.onFullscreen,
                      behavior: HitTestBehavior.opaque,
                      child: Container(
                        padding: const EdgeInsets.all(6),
                        decoration: BoxDecoration(
                          color: _surfaceAlt,
                          borderRadius: BorderRadius.circular(8),
                          border: Border.all(color: _hairline),
                        ),
                        child: const Icon(Icons.fullscreen_rounded,
                            size: 18, color: _muted),
                      ),
                    ),
                  ),
                ],
              ),
The body is a `ListView` inside `SafeArea(top: false)` — the AppBar already owns the top inset. The price row uses `CrossAxisAlignment.end` plus a 5px bottom nudge on the pill, so the +2.41% chip sits on the price's visual baseline instead of floating mid-cap-height. The $64,120.42 figure is 30px `w800` with `FontFeature.tabularFigures()` — monospaced digits, so when a live feed updates the price the layout doesn't shimmy. The change pill is `_up` at `alpha: 0.14` behind full-strength green text, the same tint-plus-ink recipe used everywhere on the screen. The chart itself is a 220px `SizedBox` driving `CustomPaint(size: Size.infinite)` inside a `Stack`; a `Positioned` fullscreen chip sits top-right as a `GestureDetector` with `HitTestBehavior.opaque`, so the whole 6px-padded `_surfaceAlt` chip is tappable, not just the 18px icon. Overlaying it on the chart — rather than parking it in the AppBar — keeps the control on the thing it expands.
Timeframe pills and the stats card
              const SizedBox(height: 14),
              Row(
                children: List<Widget>.generate(_frames.length, (int i) {
                  final bool sel = i == _frame;
                  return Expanded(
                    child: GestureDetector(
                      onTap: () => setState(() => _frame = i),
                      behavior: HitTestBehavior.opaque,
                      child: Container(
                        margin: const EdgeInsets.symmetric(horizontal: 3),
                        height: 32,
                        alignment: Alignment.center,
                        decoration: BoxDecoration(
                          color: sel ? _surfaceAlt : Colors.transparent,
                          borderRadius: BorderRadius.circular(8),
                          border: Border.all(
                            color: sel ? _brand : Colors.transparent,
                          ),
                        ),
                        child: Text(
                          _frames[i],
                          style: TextStyle(
                            fontFamily: _font,
                            fontSize: 12.5,
                            fontWeight: FontWeight.w700,
                            color: sel ? _brand : _muted,
                          ),
                        ),
                      ),
                    ),
                  );
                }),
              ),
              const SizedBox(height: 22),
              Container(
                padding: const EdgeInsets.all(16),
                decoration: BoxDecoration(
                  color: _surface,
                  borderRadius: BorderRadius.circular(16),
                  border: Border.all(color: _hairline),
                ),
                child: Column(
                  children: const <Widget>[
                    _StatRow(label: '24h High', value: '\$64,840.00'),
                    _StatRow(label: '24h Low', value: '\$62,510.00'),
                    _StatRow(label: 'Market Cap', value: '\$1.26T'),
                    _StatRow(label: '24h Volume', value: '\$28.4B'),
                    _StatRow(
                        label: 'Circulating', value: '19.7M BTC', last: true),
                  ],
                ),
              ),
            ],
          ),
        ),
The selector is `List<Widget>.generate` over `_frames`, each pill wrapped in `Expanded` so all six share the row equally whether the label is `1H` or `ALL`. Selection is a single int compare — `final bool sel = i == _frame` — and a tap runs `setState(() => _frame = i)`. The selected pill gets an `_surfaceAlt` fill, a gold border and gold text; unselected pills keep transparent fills *and* transparent borders, which is the trick that stops the row reflowing on selection — every pill always has a border, only its colour changes. `HitTestBehavior.opaque` again makes the full 32px-tall pill the tap target. Below, the stats card is a `_surface` Container (radius 16, hairline border) holding five `const _StatRow`s — 24h High/Low, Market Cap, 24h Volume, Circulating — with `last: true` on the final row so the card's own 16px padding closes the bottom cleanly.
The pinned Buy/Sell bar
        bottomNavigationBar: Container(
          decoration: const BoxDecoration(
            color: _bg,
            border: Border(top: BorderSide(color: _hairline)),
          ),
          child: SafeArea(
            top: false,
            child: Padding(
              padding: const EdgeInsets.fromLTRB(20, 12, 20, 12),
              child: Row(
                children: <Widget>[
                  Expanded(
                    child: SizedBox(
                      height: 52,
                      child: FilledButton(
                        onPressed: widget.onBuy,
                        style: FilledButton.styleFrom(
                          backgroundColor: _up,
                          shape: RoundedRectangleBorder(
                            borderRadius: BorderRadius.circular(14),
                          ),
                        ),
                        child: const Text(
                          'Buy',
                          style: TextStyle(
                            fontFamily: _font,
                            fontSize: 16,
                            fontWeight: FontWeight.w700,
                            color: _bg,
                          ),
                        ),
                      ),
                    ),
                  ),
                  const SizedBox(width: 12),
                  Expanded(
                    child: SizedBox(
                      height: 52,
                      child: FilledButton(
                        onPressed: widget.onSell,
                        style: FilledButton.styleFrom(
                          backgroundColor: _down,
                          shape: RoundedRectangleBorder(
                            borderRadius: BorderRadius.circular(14),
                          ),
                        ),
                        child: const Text(
                          'Sell',
                          style: TextStyle(
                            fontFamily: _font,
                            fontSize: 16,
                            fontWeight: FontWeight.w700,
                            color: _bg,
                          ),
                        ),
                      ),
                    ),
                  ),
                ],
              ),
            ),
          ),
        ),
      ),
    );
  }
}
The trade bar lives in `bottomNavigationBar`, so it never scrolls away — on a trading screen the actions must survive any scroll position. The outer Container paints `_bg` with a top hairline `Border`, and `SafeArea(top: false)` sits *inside* it, so the background extends under the home indicator while the buttons stay above it. Both actions are `Expanded` 52px `FilledButton`s with radius-14 corners: Buy on `_up` green, Sell on `_down` red, separated by 12px. Notice they are deliberately equal — same size, same fill style. An e-commerce screen ranks its primary action, but a trading screen must not editorialise between buying and selling. Both labels are 16px `w700` in `_bg`, the near-black background colour, because dark ink on those bright fills carries far better contrast than white would.
_StatRow: one row, one padding flag
class _StatRow extends StatelessWidget {
  const _StatRow({required this.label, required this.value, this.last = false});

  final String label;
  final String value;
  final bool last;

  @override
  Widget build(BuildContext context) {
    return Padding(
      padding: EdgeInsets.only(bottom: last ? 0 : 13),
      child: Row(
        children: <Widget>[
          Text(
            label,
            style: const TextStyle(
              fontFamily: _Web3CoinOverviewScreenState._font,
              fontSize: 13.5,
              color: _Web3CoinOverviewScreenState._muted,
            ),
          ),
          const Spacer(),
          Text(
            value,
            style: const TextStyle(
              fontFamily: _Web3CoinOverviewScreenState._font,
              fontSize: 13.5,
              fontWeight: FontWeight.w600,
              fontFeatures: <FontFeature>[FontFeature.tabularFigures()],
              color: _Web3CoinOverviewScreenState._text,
            ),
          ),
        ],
      ),
    );
  }
}
`_StatRow` is a tiny stateless widget: muted 13.5px label, `Spacer`, then the value at `w600` with `FontFeature.tabularFigures()` so columns of figures align digit-for-digit down the card. Spacing is handled by `EdgeInsets.only(bottom: last ? 0 : 13)` — each row owns its own gap and the `last` flag removes it, an alternative to the collection-if spread that keeps every child `const`-constructible in the parent's list. The styles reach into `_Web3CoinOverviewScreenState._font` and its colour constants directly; since both classes share a file, that keeps a single source of truth for the palette instead of duplicating hex values in a second widget.
_CandlePainter: geometry, dojis and a hand-rolled dash
/// Candlestick chart: OHLC candles + volume bars under a faint grid.
class _CandlePainter extends CustomPainter {
  const _CandlePainter({required this.candles});

  final List<List<double>> candles;

  @override
  void paint(Canvas canvas, Size size) {
    const Color up = Color(0xFF2EBD85);
    const Color down = Color(0xFFF6465D);
    const Color grid = Color(0xFF2B3139);

    final double volH = size.height * 0.22;
    final double priceH = size.height - volH - 8;

    double minP = double.infinity;
    double maxP = -double.infinity;
    for (final List<double> c in candles) {
      if (c[2] < minP) minP = c[2];
      if (c[1] > maxP) maxP = c[1];
    }
    final double range = (maxP - minP).abs() < 1e-6 ? 1 : maxP - minP;
    double yOf(double p) => priceH * (1 - (p - minP) / range);

    // Horizontal grid lines.
    final Paint gridPaint = Paint()
      ..color = grid.withValues(alpha: 0.5)
      ..strokeWidth = 1;
    for (int i = 0; i <= 4; i++) {
      final double y = priceH * i / 4;
      canvas.drawLine(Offset(0, y), Offset(size.width, y), gridPaint);
    }

    final int n = candles.length;
    final double slot = size.width / n;
    final double bodyW = slot * 0.6;

    for (int i = 0; i < n; i++) {
      final List<double> c = candles[i];
      final double cx = slot * i + slot / 2;
      final bool isUp = c[3] >= c[0];
      final Color col = isUp ? up : down;
      final Paint wick = Paint()
        ..color = col
        ..strokeWidth = 1.4;
      canvas.drawLine(Offset(cx, yOf(c[1])), Offset(cx, yOf(c[2])), wick);
      final double yo = yOf(c[0]);
      final double yc = yOf(c[3]);
      final Rect body = Rect.fromLTRB(
        cx - bodyW / 2,
        yo < yc ? yo : yc,
        cx + bodyW / 2,
        (yo < yc ? yc : yo) + ((yo - yc).abs() < 1 ? 1 : 0),
      );
      canvas.drawRect(body, Paint()..color = col);

      // Volume bar (pseudo: proportional to candle range).
      final double vFrac = ((c[1] - c[2]) / range).clamp(0.12, 1.0);
      final double vh = volH * vFrac;
      final Rect vol = Rect.fromLTWH(
        cx - bodyW / 2,
        size.height - vh,
        bodyW,
        vh,
      );
      canvas.drawRect(vol, Paint()..color = col.withValues(alpha: 0.35));
    }

    // Last price dashed marker line.
    final double lastY = yOf(candles.last[3]);
    final Paint dash = Paint()
      ..color = const Color(0xFFF0B90B)
      ..strokeWidth = 1;
    double x = 0;
    while (x < size.width) {
      canvas.drawLine(Offset(x, lastY), Offset(x + 5, lastY), dash);
      x += 10;
    }
  }

  @override
  bool shouldRepaint(_CandlePainter oldDelegate) =>
      oldDelegate.candles != candles;
}
The painter first splits the canvas: `volH` takes 22% of the height for volume, `priceH` gets the rest minus an 8px gutter. It scans the series for the lowest low (`c[2]`) and highest high (`c[1]`), guards a flat series with `range < 1e-6 ? 1 : ...` to dodge a divide-by-zero, and defines `yOf` to invert prices into canvas-y (higher price, smaller y). Four grid intervals paint at 50% alpha. Each candle gets `slot = width / n` with a body 60% of the slot; the wick is a 1.4px line from high to low, and the body `Rect` spans open to close — with the subtle doji guard `((yo - yc).abs() < 1 ? 1 : 0)` padding the rect by a pixel so an open-equals-close candle still renders instead of vanishing. Volume bars are honest about being decorative: the comment says 'pseudo', deriving each bar from the candle's high-low range clamped to 0.12–1.0 and painted at `alpha: 0.35`. Finally the gold last-price marker is dashed by hand — a `while` loop drawing 5px segments every 10px — because Flutter's canvas has no built-in dash effect. `shouldRepaint` compares list identity, so the const data never repaints.
Full code
The complete, ready-to-paste source. Free to use in your projects — one click copies it all.
import 'package:flutter/material.dart';
/// Web3 coin — Overview / detail. Ticker-badge header, live price with signed
/// 24h delta, a painted candlestick chart with volume bars + grid, timeframe
/// pills (1H–ALL), a stats grid, and a pinned buy/sell bar. Self-contained per
/// CONVENTIONS.md: pure Flutter, bundled Inter font, all graphics CustomPaint
/// (no glyphs / no network image), forced dark theme so it renders standalone.
class Web3CoinOverviewScreen extends StatefulWidget {
const Web3CoinOverviewScreen({
super.key,
this.ticker = 'BTC',
this.name = 'Bitcoin',
this.onBack,
this.onBuy,
this.onSell,
this.onFavorite,
this.onFullscreen,
});
final String ticker;
final String name;
final VoidCallback? onBack;
final VoidCallback? onBuy;
final VoidCallback? onSell;
final VoidCallback? onFavorite;
final VoidCallback? onFullscreen;
@override
State<Web3CoinOverviewScreen> createState() => _Web3CoinOverviewScreenState();
}
class _Web3CoinOverviewScreenState extends State<Web3CoinOverviewScreen> {
static const String _font = 'Inter';
static const Color _bg = Color(0xFF0B0E11);
static const Color _surface = Color(0xFF161A1E);
static const Color _surfaceAlt = Color(0xFF1E2329);
static const Color _brand = Color(0xFFF0B90B);
static const Color _up = Color(0xFF2EBD85);
static const Color _down = Color(0xFFF6465D);
static const Color _text = Color(0xFFEAECEF);
static const Color _muted = Color(0xFF848E9C);
static const Color _hairline = Color(0xFF2B3139);
static const List<String> _frames = <String>[
'1H', '1D', '1W', '1M', '1Y', 'ALL',
];
// Deterministic OHLC series (open, high, low, close), price units ~ $k.
static const List<List<double>> _candles = <List<double>>[
<double>[610, 618, 606, 615], <double>[615, 622, 612, 619],
<double>[619, 625, 614, 616], <double>[616, 620, 608, 611],
<double>[611, 617, 605, 614], <double>[614, 628, 613, 626],
<double>[626, 634, 624, 630], <double>[630, 633, 619, 622],
<double>[622, 627, 617, 625], <double>[625, 640, 624, 638],
<double>[638, 645, 632, 634], <double>[634, 639, 626, 636],
<double>[636, 648, 635, 646], <double>[646, 652, 640, 642],
<double>[642, 647, 631, 633], <double>[633, 644, 630, 641],
<double>[641, 650, 639, 648], <double>[648, 655, 644, 645],
<double>[645, 651, 636, 638], <double>[638, 649, 637, 647],
<double>[647, 658, 645, 656], <double>[656, 662, 650, 652],
<double>[652, 657, 646, 655], <double>[655, 664, 653, 641],
];
int _frame = 1;
@override
Widget build(BuildContext context) {
return Theme(
data: ThemeData.dark(useMaterial3: true),
child: Scaffold(
backgroundColor: _bg,
appBar: AppBar(
backgroundColor: _bg,
elevation: 0,
leading: IconButton(
onPressed: widget.onBack,
icon: const Icon(Icons.arrow_back_ios_new_rounded,
size: 18, color: _text),
),
title: Row(
mainAxisSize: MainAxisSize.min,
children: <Widget>[
Container(
width: 28,
height: 28,
decoration: BoxDecoration(
color: _brand.withValues(alpha: 0.16),
shape: BoxShape.circle,
border: Border.all(color: _brand.withValues(alpha: 0.5)),
),
alignment: Alignment.center,
child: Text(
widget.ticker.length <= 3
? widget.ticker
: widget.ticker.substring(0, 3),
style: const TextStyle(
fontFamily: _font,
fontSize: 8.5,
fontWeight: FontWeight.w700,
color: _brand,
),
),
),
const SizedBox(width: 8),
Text(
'${widget.ticker}/USDT',
style: const TextStyle(
fontFamily: _font,
fontSize: 16,
fontWeight: FontWeight.w700,
color: _text,
),
),
],
),
actions: <Widget>[
IconButton(
onPressed: widget.onFavorite,
icon: const Icon(Icons.star_border_rounded,
size: 22, color: _text),
),
const SizedBox(width: 4),
],
),
body: SafeArea(
top: false,
child: ListView(
padding: const EdgeInsets.fromLTRB(20, 4, 20, 20),
children: <Widget>[
Row(
crossAxisAlignment: CrossAxisAlignment.end,
children: <Widget>[
const Text(
'\$64,120.42',
style: TextStyle(
fontFamily: _font,
fontSize: 30,
fontWeight: FontWeight.w800,
fontFeatures: <FontFeature>[FontFeature.tabularFigures()],
color: _text,
),
),
const SizedBox(width: 10),
Padding(
padding: const EdgeInsets.only(bottom: 5),
child: Container(
padding: const EdgeInsets.symmetric(
horizontal: 8, vertical: 3),
decoration: BoxDecoration(
color: _up.withValues(alpha: 0.14),
borderRadius: BorderRadius.circular(7),
),
child: const Text(
'+2.41%',
style: TextStyle(
fontFamily: _font,
fontSize: 13,
fontWeight: FontWeight.w700,
color: _up,
),
),
),
),
],
),
const SizedBox(height: 4),
Text(
'1 ${widget.ticker} = \$64,120.42 · 24h vol \$28.4B',
style: const TextStyle(
fontFamily: _font,
fontSize: 12.5,
color: _muted,
),
),
const SizedBox(height: 18),
Stack(
children: <Widget>[
SizedBox(
height: 220,
child: CustomPaint(
size: Size.infinite,
painter: _CandlePainter(candles: _candles),
),
),
Positioned(
top: 0,
right: 0,
child: GestureDetector(
onTap: widget.onFullscreen,
behavior: HitTestBehavior.opaque,
child: Container(
padding: const EdgeInsets.all(6),
decoration: BoxDecoration(
color: _surfaceAlt,
borderRadius: BorderRadius.circular(8),
border: Border.all(color: _hairline),
),
child: const Icon(Icons.fullscreen_rounded,
size: 18, color: _muted),
),
),
),
],
),
const SizedBox(height: 14),
Row(
children: List<Widget>.generate(_frames.length, (int i) {
final bool sel = i == _frame;
return Expanded(
child: GestureDetector(
onTap: () => setState(() => _frame = i),
behavior: HitTestBehavior.opaque,
child: Container(
margin: const EdgeInsets.symmetric(horizontal: 3),
height: 32,
alignment: Alignment.center,
decoration: BoxDecoration(
color: sel ? _surfaceAlt : Colors.transparent,
borderRadius: BorderRadius.circular(8),
border: Border.all(
color: sel ? _brand : Colors.transparent,
),
),
child: Text(
_frames[i],
style: TextStyle(
fontFamily: _font,
fontSize: 12.5,
fontWeight: FontWeight.w700,
color: sel ? _brand : _muted,
),
),
),
),
);
}),
),
const SizedBox(height: 22),
Container(
padding: const EdgeInsets.all(16),
decoration: BoxDecoration(
color: _surface,
borderRadius: BorderRadius.circular(16),
border: Border.all(color: _hairline),
),
child: Column(
children: const <Widget>[
_StatRow(label: '24h High', value: '\$64,840.00'),
_StatRow(label: '24h Low', value: '\$62,510.00'),
_StatRow(label: 'Market Cap', value: '\$1.26T'),
_StatRow(label: '24h Volume', value: '\$28.4B'),
_StatRow(
label: 'Circulating', value: '19.7M BTC', last: true),
],
),
),
],
),
),
bottomNavigationBar: Container(
decoration: const BoxDecoration(
color: _bg,
border: Border(top: BorderSide(color: _hairline)),
),
child: SafeArea(
top: false,
child: Padding(
padding: const EdgeInsets.fromLTRB(20, 12, 20, 12),
child: Row(
children: <Widget>[
Expanded(
child: SizedBox(
height: 52,
child: FilledButton(
onPressed: widget.onBuy,
style: FilledButton.styleFrom(
backgroundColor: _up,
shape: RoundedRectangleBorder(
borderRadius: BorderRadius.circular(14),
),
),
child: const Text(
'Buy',
style: TextStyle(
fontFamily: _font,
fontSize: 16,
fontWeight: FontWeight.w700,
color: _bg,
),
),
),
),
),
const SizedBox(width: 12),
Expanded(
child: SizedBox(
height: 52,
child: FilledButton(
onPressed: widget.onSell,
style: FilledButton.styleFrom(
backgroundColor: _down,
shape: RoundedRectangleBorder(
borderRadius: BorderRadius.circular(14),
),
),
child: const Text(
'Sell',
style: TextStyle(
fontFamily: _font,
fontSize: 16,
fontWeight: FontWeight.w700,
color: _bg,
),
),
),
),
),
],
),
),
),
),
),
);
}
}
class _StatRow extends StatelessWidget {
const _StatRow({required this.label, required this.value, this.last = false});
final String label;
final String value;
final bool last;
@override
Widget build(BuildContext context) {
return Padding(
padding: EdgeInsets.only(bottom: last ? 0 : 13),
child: Row(
children: <Widget>[
Text(
label,
style: const TextStyle(
fontFamily: _Web3CoinOverviewScreenState._font,
fontSize: 13.5,
color: _Web3CoinOverviewScreenState._muted,
),
),
const Spacer(),
Text(
value,
style: const TextStyle(
fontFamily: _Web3CoinOverviewScreenState._font,
fontSize: 13.5,
fontWeight: FontWeight.w600,
fontFeatures: <FontFeature>[FontFeature.tabularFigures()],
color: _Web3CoinOverviewScreenState._text,
),
),
],
),
);
}
}
/// Candlestick chart: OHLC candles + volume bars under a faint grid.
class _CandlePainter extends CustomPainter {
const _CandlePainter({required this.candles});
final List<List<double>> candles;
@override
void paint(Canvas canvas, Size size) {
const Color up = Color(0xFF2EBD85);
const Color down = Color(0xFFF6465D);
const Color grid = Color(0xFF2B3139);
final double volH = size.height * 0.22;
final double priceH = size.height - volH - 8;
double minP = double.infinity;
double maxP = -double.infinity;
for (final List<double> c in candles) {
if (c[2] < minP) minP = c[2];
if (c[1] > maxP) maxP = c[1];
}
final double range = (maxP - minP).abs() < 1e-6 ? 1 : maxP - minP;
double yOf(double p) => priceH * (1 - (p - minP) / range);
// Horizontal grid lines.
final Paint gridPaint = Paint()
..color = grid.withValues(alpha: 0.5)
..strokeWidth = 1;
for (int i = 0; i <= 4; i++) {
final double y = priceH * i / 4;
canvas.drawLine(Offset(0, y), Offset(size.width, y), gridPaint);
}
final int n = candles.length;
final double slot = size.width / n;
final double bodyW = slot * 0.6;
for (int i = 0; i < n; i++) {
final List<double> c = candles[i];
final double cx = slot * i + slot / 2;
final bool isUp = c[3] >= c[0];
final Color col = isUp ? up : down;
final Paint wick = Paint()
..color = col
..strokeWidth = 1.4;
canvas.drawLine(Offset(cx, yOf(c[1])), Offset(cx, yOf(c[2])), wick);
final double yo = yOf(c[0]);
final double yc = yOf(c[3]);
final Rect body = Rect.fromLTRB(
cx - bodyW / 2,
yo < yc ? yo : yc,
cx + bodyW / 2,
(yo < yc ? yc : yo) + ((yo - yc).abs() < 1 ? 1 : 0),
);
canvas.drawRect(body, Paint()..color = col);
// Volume bar (pseudo: proportional to candle range).
final double vFrac = ((c[1] - c[2]) / range).clamp(0.12, 1.0);
final double vh = volH * vFrac;
final Rect vol = Rect.fromLTWH(
cx - bodyW / 2,
size.height - vh,
bodyW,
vh,
);
canvas.drawRect(vol, Paint()..color = col.withValues(alpha: 0.35));
}
// Last price dashed marker line.
final double lastY = yOf(candles.last[3]);
final Paint dash = Paint()
..color = const Color(0xFFF0B90B)
..strokeWidth = 1;
double x = 0;
while (x < size.width) {
canvas.drawLine(Offset(x, lastY), Offset(x + 5, lastY), dash);
x += 10;
}
}
@override
bool shouldRepaint(_CandlePainter oldDelegate) =>
oldDelegate.candles != candles;
}
Plus bundled 1 binary asset (fonts/images). The CLI and MCP install those for you automatically.
Two faster ways to add it
Copy-paste works, but you can skip it entirely.
1. FlutterKit CLI
One command drops this screen — and its fonts — straight into your project.
$ flutterkit add web3-coin-overview2. AI agent (MCP)
Connect FlutterKit's MCP server in Claude or Cursor and just ask your agent to install web3-coin-overview — it fetches and writes the files for you.
FAQ
Can I use this coin detail screen in a commercial app?
Yes. The screen is free for personal and commercial use alike — copy the code from this page, install it with the CLI command, or pull it over MCP. There is no licence key to enter and no attribution required.
Do I need a charting package like fl_chart or candlesticks?
No. The entire chart — candles, wicks, volume bars, grid and the dashed last-price line — is `_CandlePainter`, a plain `CustomPainter` on the Flutter canvas. `pubspec.yaml` gains no dependencies at all; the only bundled asset is the Inter font the whole screen renders in.
Which Flutter version does this require?
Flutter 3.22 or newer: the code leans on `Color.withValues(alpha: ...)` (in the badge, the change pill, the grid and the volume bars) and super parameters. On an older SDK, replace each `withValues(alpha: x)` with `withOpacity(x)` and expand the constructor to the `{Key? key} : super(key: key)` form.
The timeframe pills highlight but the chart doesn't change — why?
By design. `_frame` is real state and the gold highlight proves the interaction works, but the screen ships one deterministic `_candles` series so it renders identically everywhere. To make the pills live, keep a `Map<String, List<List<double>>>` of series per frame and pass `_candlesFor(_frames[_frame])` into `_CandlePainter` — `shouldRepaint` already triggers when the list changes.
How do I feed real market data into the chart?
Replace the static `_candles` list with OHLC quads from your exchange API — most return exactly `[open, high, low, close]` per interval, so the painter needs no changes. Update the hard-coded price, delta and stats strings from the same ticker stream, and the `tabularFigures` font feature will keep the layout steady as values tick.


