How to Build a Fullscreen Candlestick Chart Screen in Flutter (Full Code + Preview)
A 220px chart squeezed under a price header is fine for a glance, but reading individual candles needs the whole screen and a way to point at one. This tutorial builds Aurum's expanded chart view in Flutter: a canvas that claims every spare pixel, a tap-placed crosshair that drives a live OHLC readout, MA(7) and VOL chips that reshape the painter, price labels drawn on the right edge, and a timeframe row. You finish with one file, one CustomPainter and four fields of state.
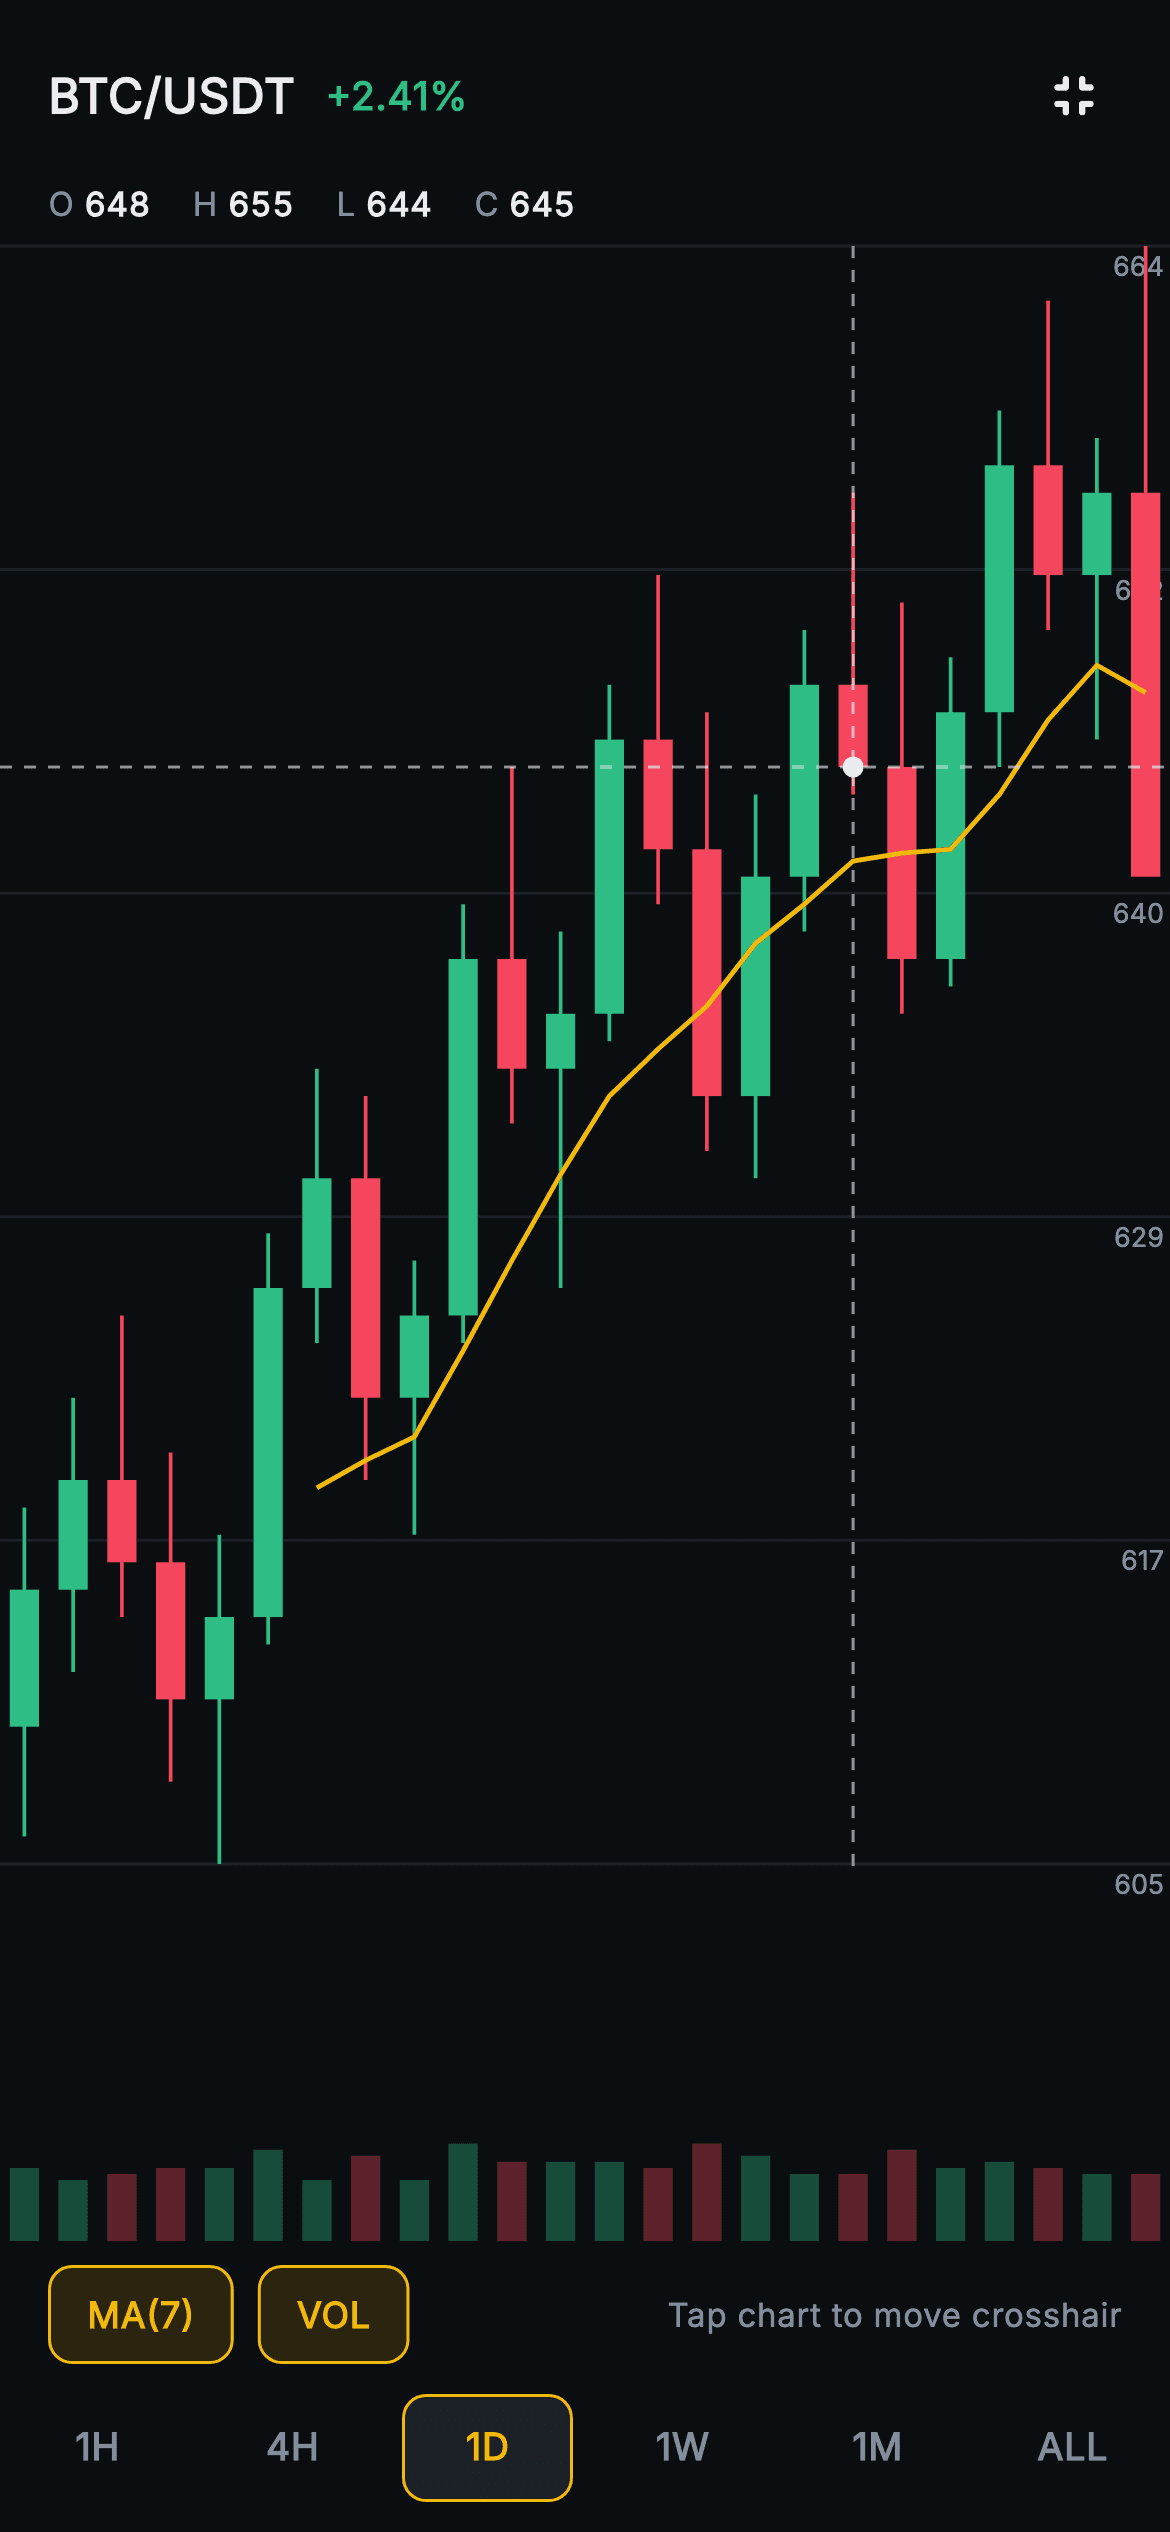
What you'll build
- ✓A candlestick chart wrapped in Expanded so it grows to fill whatever height the header and controls leave behind
- ✓A tap-to-place crosshair that converts the touch's x position into a candle index and rewrites a tabular-figure O/H/L/C strip
- ✓MA(7) and VOL toggle chips whose booleans flow straight into the painter, with VOL also rescaling the price area
- ✓Six right-aligned price labels painted with TextPainter on the gridlines, plus a 7-period moving average computed on the canvas
- ✓A dashed crosshair pinned to the selected close, and a six-way timeframe row with a gold-outlined active frame
Step-by-step build
Create the file
Add a new file at lib/web3_coin_chart_fullscreen/web3_coin_chart_fullscreen_screen.dart in your Flutter project.
Register the bundled fonts
No external packages — this is pure Flutter. It does bundle its design font (Inter), so drop the font file into fonts/ and declare it in pubspec.yaml:
flutter:
  fonts:
    - family: Inter
      fonts:
- asset: fonts/Inter-Regular.ttfBuild it, piece by piece
Here's how the screen goes together. Each block below is a real slice of the code with a plain-English explanation — paste them in order, or grab the whole file from the next section.
Two parameters, 24 candles and four fields of state
import 'package:flutter/material.dart';

/// Web3 coin — Fullscreen chart. A large candlestick chart with a moving-average
/// overlay, a crosshair readout, toggleable indicator chips (MA / VOL / grid),
/// and a timeframe row — a focused, chart-first analysis view. Self-contained
/// per CONVENTIONS.md: pure Flutter, bundled Inter font, all graphics
/// CustomPaint (no glyphs / no network image), forced dark theme so it renders
/// standalone as a route.
class Web3CoinChartFullscreenScreen extends StatefulWidget {
  const Web3CoinChartFullscreenScreen({
    super.key,
    this.ticker = 'BTC',
    this.onClose,
  });

  final String ticker;
  final VoidCallback? onClose;

  @override
  State<Web3CoinChartFullscreenScreen> createState() =>
      _Web3CoinChartFullscreenScreenState();
}

class _Web3CoinChartFullscreenScreenState
    extends State<Web3CoinChartFullscreenScreen> {
  static const String _font = 'Inter';
  static const Color _bg = Color(0xFF0B0E11);
  static const Color _surfaceAlt = Color(0xFF1E2329);
  static const Color _brand = Color(0xFFF0B90B);
  static const Color _up = Color(0xFF2EBD85);
  static const Color _text = Color(0xFFEAECEF);
  static const Color _muted = Color(0xFF848E9C);
  static const Color _hairline = Color(0xFF2B3139);

  static const List<String> _frames = <String>[
    '1H', '4H', '1D', '1W', '1M', 'ALL',
  ];

  static const List<List<double>> _candles = <List<double>>[
    <double>[610, 618, 606, 615], <double>[615, 622, 612, 619],
    <double>[619, 625, 614, 616], <double>[616, 620, 608, 611],
    <double>[611, 617, 605, 614], <double>[614, 628, 613, 626],
    <double>[626, 634, 624, 630], <double>[630, 633, 619, 622],
    <double>[622, 627, 617, 625], <double>[625, 640, 624, 638],
    <double>[638, 645, 632, 634], <double>[634, 639, 626, 636],
    <double>[636, 648, 635, 646], <double>[646, 652, 640, 642],
    <double>[642, 647, 631, 633], <double>[633, 644, 630, 641],
    <double>[641, 650, 639, 648], <double>[648, 655, 644, 645],
    <double>[645, 651, 636, 638], <double>[638, 649, 637, 647],
    <double>[647, 658, 645, 656], <double>[656, 662, 650, 652],
    <double>[652, 657, 646, 655], <double>[655, 664, 653, 641],
  ];

  int _frame = 2;
  bool _ma = true;
  bool _vol = true;
  int _cross = 17; // crosshair candle index
The public surface is deliberately small: a `ticker` that defaults to `'BTC'` and a single optional `onClose` callback, because an expanded chart is a detour from a coin page, not a destination with its own actions. The palette constants are the shared Aurum set, trimmed to the seven this file's widgets need — the down-red lives only inside the painter. `_candles` holds 24 `[open, high, low, close]` quads; the final one opens at 655 and closes at 641, so the series ends on a sharp red candle that makes the crosshair worth moving. Mutable state is just four fields: `_frame = 2` (1D), `_ma` and `_vol` both on, and `_cross = 17`, which pre-selects a candle so the readout is populated on first paint. Note the doc comment promises an 'MA / VOL / grid' chip set; the code ships only MA and VOL chips, and the grid is always drawn.
Header and the live OHLC readout
  @override
  Widget build(BuildContext context) {
    final List<double> sel = _candles[_cross];
    return Theme(
      data: ThemeData.dark(useMaterial3: true),
      child: Scaffold(
        backgroundColor: _bg,
        body: SafeArea(
          child: Column(
            crossAxisAlignment: CrossAxisAlignment.stretch,
            children: <Widget>[
              Padding(
                padding: const EdgeInsets.fromLTRB(16, 8, 8, 4),
                child: Row(
                  children: <Widget>[
                    Text(
                      '${widget.ticker}/USDT',
                      style: const TextStyle(
                        fontFamily: _font,
                        fontSize: 16,
                        fontWeight: FontWeight.w700,
                        color: _text,
                      ),
                    ),
                    const SizedBox(width: 10),
                    const Text(
                      '+2.41%',
                      style: TextStyle(
                        fontFamily: _font,
                        fontSize: 13,
                        fontWeight: FontWeight.w700,
                        color: _up,
                      ),
                    ),
                    const Spacer(),
                    IconButton(
                      onPressed: widget.onClose,
                      icon: const Icon(Icons.fullscreen_exit_rounded,
                          size: 22, color: _text),
                    ),
                  ],
                ),
              ),
              // Crosshair readout (OHLC at the selected candle).
              Padding(
                padding: const EdgeInsets.symmetric(horizontal: 16),
                child: Row(
                  children: <Widget>[
                    _ohlc('O', sel[0]),
                    _ohlc('H', sel[1]),
                    _ohlc('L', sel[2]),
                    _ohlc('C', sel[3]),
                  ],
                ),
              ),
`build` starts by resolving `final List<double> sel = _candles[_cross]` once, so the whole readout depends on a single lookup. The screen is a `Column` with `CrossAxisAlignment.stretch` inside `SafeArea`, which is what lets the chart run edge to edge later. The header row pairs `'${widget.ticker}/USDT'` at 16px `w700` with a hard-coded green `+2.41%`, then a `Spacer` shoves a `fullscreen_exit_rounded` `IconButton` to the right. Its padding is `fromLTRB(16, 8, 8, 4)` — only 8 on the right because the IconButton already carries its own 48px touch box, so a matching 16 would push the icon visibly inward. Since `onClose` is nullable, leaving it unset renders the button disabled rather than crashing. Below, four `_ohlc` calls lay out O, H, L and C for the selected candle, so on launch the strip reads 648 / 655 / 644 / 645.
Expanded chart and tap-to-candle mapping
              const SizedBox(height: 6),
              Expanded(
                child: GestureDetector(
                  behavior: HitTestBehavior.opaque,
                  onTapDown: (TapDownDetails d) {
                    final double w = context.size?.width ?? 360;
                    final double slot = w / _candles.length;
                    setState(() {
                      _cross = (d.localPosition.dx / slot)
                          .floor()
                          .clamp(0, _candles.length - 1);
                    });
                  },
                  child: CustomPaint(
                    size: Size.infinite,
                    painter: _FullCandlePainter(
                      candles: _candles,
                      showMa: _ma,
                      showVol: _vol,
                      cross: _cross,
                    ),
                  ),
                ),
              ),
This is the part that makes it a fullscreen view: the `CustomPaint` sits inside `Expanded` with `size: Size.infinite`, so the chart has no fixed height and absorbs whatever the header, chips and timeframe row leave over — taller phones simply get taller candles. The `GestureDetector` uses `HitTestBehavior.opaque` so empty canvas between candles still catches taps. `onTapDown` divides the width into 24 equal slots, floors `d.localPosition.dx / slot`, and clamps to `0..23`, mirroring the painter's own `slot = size.width / n` so a tap lands on the candle under the finger. One subtlety: the width comes from `context.size`, the State's context, meaning the whole screen rather than the chart box. That only matches because the chart is full-bleed with no horizontal padding. Interaction is tap only — there is no drag handler, so scrubbing means repeated taps.
Indicator chips, hint text and the timeframe row
              const SizedBox(height: 8),
              Padding(
                padding: const EdgeInsets.symmetric(horizontal: 16),
                child: Row(
                  children: <Widget>[
                    _Chip(
                      label: 'MA(7)',
                      on: _ma,
                      onTap: () => setState(() => _ma = !_ma),
                    ),
                    const SizedBox(width: 8),
                    _Chip(
                      label: 'VOL',
                      on: _vol,
                      onTap: () => setState(() => _vol = !_vol),
                    ),
                    const Spacer(),
                    Text(
                      'Tap chart to move crosshair',
                      style: const TextStyle(
                        fontFamily: _font,
                        fontSize: 11,
                        color: _muted,
                      ),
                    ),
                  ],
                ),
              ),
              const SizedBox(height: 10),
              SizedBox(
                height: 36,
                child: Row(
                  children: List<Widget>.generate(_frames.length, (int i) {
                    final bool s = i == _frame;
                    return Expanded(
                      child: GestureDetector(
                        onTap: () => setState(() => _frame = i),
                        behavior: HitTestBehavior.opaque,
                        child: Container(
                          margin: const EdgeInsets.symmetric(horizontal: 4),
                          alignment: Alignment.center,
                          decoration: BoxDecoration(
                            color: s ? _surfaceAlt : Colors.transparent,
                            borderRadius: BorderRadius.circular(8),
                            border: Border.all(
                              color: s ? _brand : Colors.transparent,
                            ),
                          ),
                          child: Text(
                            _frames[i],
                            style: TextStyle(
                              fontFamily: _font,
                              fontSize: 12.5,
                              fontWeight: FontWeight.w700,
                              color: s ? _brand : _muted,
                            ),
                          ),
                        ),
                      ),
                    );
                  }),
                ),
              ),
              const SizedBox(height: 10),
            ],
          ),
        ),
      ),
    );
  }
Below the canvas, two `_Chip`s flip `_ma` and `_vol` with `setState(() => _ma = !_ma)`; because those booleans are constructor arguments to `_FullCandlePainter`, the toggle and the redraw are the same event. A muted 11px 'Tap chart to move crosshair' hint fills the right side — useful because nothing about a static chart advertises that it is tappable. The timeframe row is a fixed 36px `SizedBox` generating six `Expanded` cells with 4px side margins. The active cell gets a `_surfaceAlt` fill, a `_brand` border and gold text; inactive cells keep a transparent border so the outline appears without shifting anything. Be aware that `_frame` only drives this highlight: the painter never receives it, so tapping 1W or ALL leaves the candles unchanged until you supply a series per frame.
The _ohlc cell and the _Chip toggle
  Widget _ohlc(String k, double v) {
    return Padding(
      padding: const EdgeInsets.only(right: 14),
      child: Row(
        children: <Widget>[
          Text(
            '$k ',
            style: const TextStyle(
              fontFamily: _font,
              fontSize: 11,
              color: _muted,
            ),
          ),
          Text(
            v.toStringAsFixed(0),
            style: const TextStyle(
              fontFamily: _font,
              fontSize: 11,
              fontWeight: FontWeight.w700,
              fontFeatures: <FontFeature>[FontFeature.tabularFigures()],
              color: _text,
            ),
          ),
        ],
      ),
    );
  }
}

class _Chip extends StatelessWidget {
  const _Chip({required this.label, required this.on, required this.onTap});

  final String label;
  final bool on;
  final VoidCallback onTap;

  @override
  Widget build(BuildContext context) {
    return GestureDetector(
      onTap: onTap,
      behavior: HitTestBehavior.opaque,
      child: Container(
        padding: const EdgeInsets.symmetric(horizontal: 12, vertical: 7),
        decoration: BoxDecoration(
          color: on
              ? _Web3CoinChartFullscreenScreenState._brand
                  .withValues(alpha: 0.14)
              : Colors.transparent,
          borderRadius: BorderRadius.circular(8),
          border: Border.all(
            color: on
                ? _Web3CoinChartFullscreenScreenState._brand
                : _Web3CoinChartFullscreenScreenState._hairline,
          ),
        ),
        child: Text(
          label,
          style: TextStyle(
            fontFamily: _Web3CoinChartFullscreenScreenState._font,
            fontSize: 12,
            fontWeight: FontWeight.w700,
            color: on
                ? _Web3CoinChartFullscreenScreenState._brand
                : _Web3CoinChartFullscreenScreenState._muted,
          ),
        ),
      ),
    );
  }
}
`_ohlc` renders a muted 11px key letter followed by the value at `w700`, rounded with `toStringAsFixed(0)` and set in `FontFeature.tabularFigures()`. Fixed-width digits matter here more than almost anywhere: as you tap from candle to candle the four numbers change on every touch, and proportional figures would make the whole strip twitch sideways. Each cell takes 14px of trailing padding instead of using `Spacer`s, so the readout stays compact on the left. `_Chip` is a stateless pill whose look is entirely derived from its `on` flag — a `_brand.withValues(alpha: 0.14)` wash with a gold border and gold label when active, transparent with a `_hairline` border and muted label when off. It reads the palette straight from `_Web3CoinChartFullscreenScreenState`'s static constants, which keeps every hex value defined once in the file.
Painter layout, right-axis labels and candle bodies
class _FullCandlePainter extends CustomPainter {
  const _FullCandlePainter({
    required this.candles,
    required this.showMa,
    required this.showVol,
    required this.cross,
  });

  final List<List<double>> candles;
  final bool showMa;
  final bool showVol;
  final int cross;

  @override
  void paint(Canvas canvas, Size size) {
    const Color up = Color(0xFF2EBD85);
    const Color down = Color(0xFFF6465D);
    const Color grid = Color(0xFF2B3139);
    const Color brand = Color(0xFFF0B90B);

    final double volH = showVol ? size.height * 0.18 : 0;
    final double priceH = size.height - volH - (showVol ? 6 : 0);

    double minP = double.infinity;
    double maxP = -double.infinity;
    for (final List<double> c in candles) {
      if (c[2] < minP) minP = c[2];
      if (c[1] > maxP) maxP = c[1];
    }
    final double range = (maxP - minP).abs() < 1e-6 ? 1 : maxP - minP;
    double yOf(double p) => priceH * (1 - (p - minP) / range);

    final Paint gridPaint = Paint()
      ..color = grid.withValues(alpha: 0.5)
      ..strokeWidth = 1;
    for (int i = 0; i <= 5; i++) {
      final double y = priceH * i / 5;
      canvas.drawLine(Offset(0, y), Offset(size.width, y), gridPaint);
      final TextPainter tp = TextPainter(
        text: TextSpan(
          text: (maxP - range * i / 5).toStringAsFixed(0),
          style: const TextStyle(
            fontFamily: 'Inter',
            fontSize: 9,
            color: Color(0xFF848E9C),
          ),
        ),
        textDirection: TextDirection.ltr,
      )..layout();
      tp.paint(canvas, Offset(size.width - tp.width - 2, y + 1));
    }

    final int n = candles.length;
    final double slot = size.width / n;
    final double bodyW = slot * 0.6;

    for (int i = 0; i < n; i++) {
      final List<double> c = candles[i];
      final double cx = slot * i + slot / 2;
      final bool isUp = c[3] >= c[0];
      final Color col = isUp ? up : down;
      final Paint wick = Paint()
        ..color = col
        ..strokeWidth = 1.2;
      canvas.drawLine(Offset(cx, yOf(c[1])), Offset(cx, yOf(c[2])), wick);
      final double yo = yOf(c[0]);
      final double yc = yOf(c[3]);
      final double top = yo < yc ? yo : yc;
      final double h = (yo - yc).abs() < 1 ? 1 : (yo - yc).abs();
      canvas.drawRect(
        Rect.fromLTWH(cx - bodyW / 2, top, bodyW, h),
        Paint()..color = col,
      );
      if (showVol) {
        final double vFrac = ((c[1] - c[2]) / range).clamp(0.12, 1.0);
        final double vh = volH * vFrac;
        canvas.drawRect(
          Rect.fromLTWH(cx - bodyW / 2, size.height - vh, bodyW, vh),
          Paint()..color = col.withValues(alpha: 0.35),
        );
      }
    }
`_FullCandlePainter` first decides how much height volume gets: `volH` is 18% when `showVol` is true, with a 6px gap, and zero otherwise — so switching VOL off lets `priceH` take the full canvas and the candles visibly stretch. The price range spans the lowest low to the highest high with a `1e-6` guard against a flat series, and `yOf` maps prices with no top padding, so the 664 wick touches the very top edge. Six gridlines (`i` from 0 to 5) are drawn at 50% alpha, each labelled by a 9px `TextPainter` laid out, then painted at `size.width - tp.width - 2` to right-align it like an exchange's price axis. Labels are painted before candles, so bodies overdraw them where they collide. Candles use a 1.2px wick and a body 60% of the slot, with a minimum 1px height for near-equal open and close. Volume bars are invented: their height is each candle's high-low range over the total range, clamped to 0.12–1.0, at 35% alpha.
Moving average, crosshair and repaint rules
    // 7-period moving average overlay on close.
    if (showMa) {
      final Path ma = Path();
      bool started = false;
      for (int i = 0; i < n; i++) {
        if (i < 6) continue;
        double sum = 0;
        for (int j = i - 6; j <= i; j++) {
          sum += candles[j][3];
        }
        final double avg = sum / 7;
        final double x = slot * i + slot / 2;
        final double y = yOf(avg);
        started ? ma.lineTo(x, y) : ma.moveTo(x, y);
        started = true;
      }
      canvas.drawPath(
        ma,
        Paint()
          ..style = PaintingStyle.stroke
          ..strokeWidth = 1.6
          ..color = brand,
      );
    }

    // Crosshair.
    final double cx = slot * cross + slot / 2;
    final double cy = yOf(candles[cross][3]);
    final Paint ch = Paint()
      ..color = const Color(0xFFEAECEF).withValues(alpha: 0.6)
      ..strokeWidth = 1;
    _dashV(canvas, cx, 0, priceH, ch);
    _dashH(canvas, 0, size.width, cy, ch);
    canvas.drawCircle(
        Offset(cx, cy), 3.5, Paint()..color = const Color(0xFFEAECEF));
  }

  void _dashV(Canvas c, double x, double y0, double y1, Paint p) {
    double y = y0;
    while (y < y1) {
      c.drawLine(Offset(x, y), Offset(x, y + 4), p);
      y += 8;
    }
  }

  void _dashH(Canvas c, double x0, double x1, double y, Paint p) {
    double x = x0;
    while (x < x1) {
      c.drawLine(Offset(x, y), Offset(x + 4, y), p);
      x += 8;
    }
  }

  @override
  bool shouldRepaint(_FullCandlePainter oldDelegate) =>
      oldDelegate.candles != candles ||
      oldDelegate.showMa != showMa ||
      oldDelegate.showVol != showVol ||
      oldDelegate.cross != cross;
}
The MA(7) line is computed on the canvas rather than precomputed: for each index from 6 onward it sums the previous seven closes, divides by 7, and extends a `Path`, using a `started` flag to choose `moveTo` for the first point and `lineTo` after. The first six candles therefore have no average, which is correct — a seven-period mean needs seven periods. The path is a 1.6px gold stroke. The crosshair is placed at the selected candle's centre and its close price; the vertical line spans only `priceH` so it never cuts through the volume bars, while the horizontal line crosses the full width, and a solid 3.5px `#EAECEF` dot marks the intersection. `_dashV` and `_dashH` walk the line in 8px steps drawing 4px segments, giving an even half-on dash. `shouldRepaint` compares all four inputs, so any tap or chip toggle repaints and nothing else does.
Full code
The complete, ready-to-paste source. Free to use in your projects — one click copies it all.
import 'package:flutter/material.dart';

/// Web3 coin — Fullscreen chart. A large candlestick chart with a moving-average
/// overlay, a crosshair readout, toggleable indicator chips (MA / VOL / grid),
/// and a timeframe row — a focused, chart-first analysis view. Self-contained
/// per CONVENTIONS.md: pure Flutter, bundled Inter font, all graphics
/// CustomPaint (no glyphs / no network image), forced dark theme so it renders
/// standalone as a route.
class Web3CoinChartFullscreenScreen extends StatefulWidget {
  const Web3CoinChartFullscreenScreen({
    super.key,
    this.ticker = 'BTC',
    this.onClose,
  });

  final String ticker;
  final VoidCallback? onClose;

  @override
  State<Web3CoinChartFullscreenScreen> createState() =>
      _Web3CoinChartFullscreenScreenState();
}

class _Web3CoinChartFullscreenScreenState
    extends State<Web3CoinChartFullscreenScreen> {
  static const String _font = 'Inter';
  static const Color _bg = Color(0xFF0B0E11);
  static const Color _surfaceAlt = Color(0xFF1E2329);
  static const Color _brand = Color(0xFFF0B90B);
  static const Color _up = Color(0xFF2EBD85);
  static const Color _text = Color(0xFFEAECEF);
  static const Color _muted = Color(0xFF848E9C);
  static const Color _hairline = Color(0xFF2B3139);

  static const List<String> _frames = <String>[
    '1H', '4H', '1D', '1W', '1M', 'ALL',
  ];

  static const List<List<double>> _candles = <List<double>>[
    <double>[610, 618, 606, 615], <double>[615, 622, 612, 619],
    <double>[619, 625, 614, 616], <double>[616, 620, 608, 611],
    <double>[611, 617, 605, 614], <double>[614, 628, 613, 626],
    <double>[626, 634, 624, 630], <double>[630, 633, 619, 622],
    <double>[622, 627, 617, 625], <double>[625, 640, 624, 638],
    <double>[638, 645, 632, 634], <double>[634, 639, 626, 636],
    <double>[636, 648, 635, 646], <double>[646, 652, 640, 642],
    <double>[642, 647, 631, 633], <double>[633, 644, 630, 641],
    <double>[641, 650, 639, 648], <double>[648, 655, 644, 645],
    <double>[645, 651, 636, 638], <double>[638, 649, 637, 647],
    <double>[647, 658, 645, 656], <double>[656, 662, 650, 652],
    <double>[652, 657, 646, 655], <double>[655, 664, 653, 641],
  ];

  int _frame = 2;
  bool _ma = true;
  bool _vol = true;
  int _cross = 17; // crosshair candle index

  @override
  Widget build(BuildContext context) {
    final List<double> sel = _candles[_cross];
    return Theme(
      data: ThemeData.dark(useMaterial3: true),
      child: Scaffold(
        backgroundColor: _bg,
        body: SafeArea(
          child: Column(
            crossAxisAlignment: CrossAxisAlignment.stretch,
            children: <Widget>[
              Padding(
                padding: const EdgeInsets.fromLTRB(16, 8, 8, 4),
                child: Row(
                  children: <Widget>[
                    Text(
                      '${widget.ticker}/USDT',
                      style: const TextStyle(
                        fontFamily: _font,
                        fontSize: 16,
                        fontWeight: FontWeight.w700,
                        color: _text,
                      ),
                    ),
                    const SizedBox(width: 10),
                    const Text(
                      '+2.41%',
                      style: TextStyle(
                        fontFamily: _font,
                        fontSize: 13,
                        fontWeight: FontWeight.w700,
                        color: _up,
                      ),
                    ),
                    const Spacer(),
                    IconButton(
                      onPressed: widget.onClose,
                      icon: const Icon(Icons.fullscreen_exit_rounded,
                          size: 22, color: _text),
                    ),
                  ],
                ),
              ),
              // Crosshair readout (OHLC at the selected candle).
              Padding(
                padding: const EdgeInsets.symmetric(horizontal: 16),
                child: Row(
                  children: <Widget>[
                    _ohlc('O', sel[0]),
                    _ohlc('H', sel[1]),
                    _ohlc('L', sel[2]),
                    _ohlc('C', sel[3]),
                  ],
                ),
              ),
              const SizedBox(height: 6),
              Expanded(
                child: GestureDetector(
                  behavior: HitTestBehavior.opaque,
                  onTapDown: (TapDownDetails d) {
                    final double w = context.size?.width ?? 360;
                    final double slot = w / _candles.length;
                    setState(() {
                      _cross = (d.localPosition.dx / slot)
                          .floor()
                          .clamp(0, _candles.length - 1);
                    });
                  },
                  child: CustomPaint(
                    size: Size.infinite,
                    painter: _FullCandlePainter(
                      candles: _candles,
                      showMa: _ma,
                      showVol: _vol,
                      cross: _cross,
                    ),
                  ),
                ),
              ),
              const SizedBox(height: 8),
              Padding(
                padding: const EdgeInsets.symmetric(horizontal: 16),
                child: Row(
                  children: <Widget>[
                    _Chip(
                      label: 'MA(7)',
                      on: _ma,
                      onTap: () => setState(() => _ma = !_ma),
                    ),
                    const SizedBox(width: 8),
                    _Chip(
                      label: 'VOL',
                      on: _vol,
                      onTap: () => setState(() => _vol = !_vol),
                    ),
                    const Spacer(),
                    Text(
                      'Tap chart to move crosshair',
                      style: const TextStyle(
                        fontFamily: _font,
                        fontSize: 11,
                        color: _muted,
                      ),
                    ),
                  ],
                ),
              ),
              const SizedBox(height: 10),
              SizedBox(
                height: 36,
                child: Row(
                  children: List<Widget>.generate(_frames.length, (int i) {
                    final bool s = i == _frame;
                    return Expanded(
                      child: GestureDetector(
                        onTap: () => setState(() => _frame = i),
                        behavior: HitTestBehavior.opaque,
                        child: Container(
                          margin: const EdgeInsets.symmetric(horizontal: 4),
                          alignment: Alignment.center,
                          decoration: BoxDecoration(
                            color: s ? _surfaceAlt : Colors.transparent,
                            borderRadius: BorderRadius.circular(8),
                            border: Border.all(
                              color: s ? _brand : Colors.transparent,
                            ),
                          ),
                          child: Text(
                            _frames[i],
                            style: TextStyle(
                              fontFamily: _font,
                              fontSize: 12.5,
                              fontWeight: FontWeight.w700,
                              color: s ? _brand : _muted,
                            ),
                          ),
                        ),
                      ),
                    );
                  }),
                ),
              ),
              const SizedBox(height: 10),
            ],
          ),
        ),
      ),
    );
  }

  Widget _ohlc(String k, double v) {
    return Padding(
      padding: const EdgeInsets.only(right: 14),
      child: Row(
        children: <Widget>[
          Text(
            '$k ',
            style: const TextStyle(
              fontFamily: _font,
              fontSize: 11,
              color: _muted,
            ),
          ),
          Text(
            v.toStringAsFixed(0),
            style: const TextStyle(
              fontFamily: _font,
              fontSize: 11,
              fontWeight: FontWeight.w700,
              fontFeatures: <FontFeature>[FontFeature.tabularFigures()],
              color: _text,
            ),
          ),
        ],
      ),
    );
  }
}

class _Chip extends StatelessWidget {
  const _Chip({required this.label, required this.on, required this.onTap});

  final String label;
  final bool on;
  final VoidCallback onTap;

  @override
  Widget build(BuildContext context) {
    return GestureDetector(
      onTap: onTap,
      behavior: HitTestBehavior.opaque,
      child: Container(
        padding: const EdgeInsets.symmetric(horizontal: 12, vertical: 7),
        decoration: BoxDecoration(
          color: on
              ? _Web3CoinChartFullscreenScreenState._brand
                  .withValues(alpha: 0.14)
              : Colors.transparent,
          borderRadius: BorderRadius.circular(8),
          border: Border.all(
            color: on
                ? _Web3CoinChartFullscreenScreenState._brand
                : _Web3CoinChartFullscreenScreenState._hairline,
          ),
        ),
        child: Text(
          label,
          style: TextStyle(
            fontFamily: _Web3CoinChartFullscreenScreenState._font,
            fontSize: 12,
            fontWeight: FontWeight.w700,
            color: on
                ? _Web3CoinChartFullscreenScreenState._brand
                : _Web3CoinChartFullscreenScreenState._muted,
          ),
        ),
      ),
    );
  }
}

class _FullCandlePainter extends CustomPainter {
  const _FullCandlePainter({
    required this.candles,
    required this.showMa,
    required this.showVol,
    required this.cross,
  });

  final List<List<double>> candles;
  final bool showMa;
  final bool showVol;
  final int cross;

  @override
  void paint(Canvas canvas, Size size) {
    const Color up = Color(0xFF2EBD85);
    const Color down = Color(0xFFF6465D);
    const Color grid = Color(0xFF2B3139);
    const Color brand = Color(0xFFF0B90B);

    final double volH = showVol ? size.height * 0.18 : 0;
    final double priceH = size.height - volH - (showVol ? 6 : 0);

    double minP = double.infinity;
    double maxP = -double.infinity;
    for (final List<double> c in candles) {
      if (c[2] < minP) minP = c[2];
      if (c[1] > maxP) maxP = c[1];
    }
    final double range = (maxP - minP).abs() < 1e-6 ? 1 : maxP - minP;
    double yOf(double p) => priceH * (1 - (p - minP) / range);

    final Paint gridPaint = Paint()
      ..color = grid.withValues(alpha: 0.5)
      ..strokeWidth = 1;
    for (int i = 0; i <= 5; i++) {
      final double y = priceH * i / 5;
      canvas.drawLine(Offset(0, y), Offset(size.width, y), gridPaint);
      final TextPainter tp = TextPainter(
        text: TextSpan(
          text: (maxP - range * i / 5).toStringAsFixed(0),
          style: const TextStyle(
            fontFamily: 'Inter',
            fontSize: 9,
            color: Color(0xFF848E9C),
          ),
        ),
        textDirection: TextDirection.ltr,
      )..layout();
      tp.paint(canvas, Offset(size.width - tp.width - 2, y + 1));
    }

    final int n = candles.length;
    final double slot = size.width / n;
    final double bodyW = slot * 0.6;

    for (int i = 0; i < n; i++) {
      final List<double> c = candles[i];
      final double cx = slot * i + slot / 2;
      final bool isUp = c[3] >= c[0];
      final Color col = isUp ? up : down;
      final Paint wick = Paint()
        ..color = col
        ..strokeWidth = 1.2;
      canvas.drawLine(Offset(cx, yOf(c[1])), Offset(cx, yOf(c[2])), wick);
      final double yo = yOf(c[0]);
      final double yc = yOf(c[3]);
      final double top = yo < yc ? yo : yc;
      final double h = (yo - yc).abs() < 1 ? 1 : (yo - yc).abs();
      canvas.drawRect(
        Rect.fromLTWH(cx - bodyW / 2, top, bodyW, h),
        Paint()..color = col,
      );
      if (showVol) {
        final double vFrac = ((c[1] - c[2]) / range).clamp(0.12, 1.0);
        final double vh = volH * vFrac;
        canvas.drawRect(
          Rect.fromLTWH(cx - bodyW / 2, size.height - vh, bodyW, vh),
          Paint()..color = col.withValues(alpha: 0.35),
        );
      }
    }

    // 7-period moving average overlay on close.
    if (showMa) {
      final Path ma = Path();
      bool started = false;
      for (int i = 0; i < n; i++) {
        if (i < 6) continue;
        double sum = 0;
        for (int j = i - 6; j <= i; j++) {
          sum += candles[j][3];
        }
        final double avg = sum / 7;
        final double x = slot * i + slot / 2;
        final double y = yOf(avg);
        started ? ma.lineTo(x, y) : ma.moveTo(x, y);
        started = true;
      }
      canvas.drawPath(
        ma,
        Paint()
          ..style = PaintingStyle.stroke
          ..strokeWidth = 1.6
          ..color = brand,
      );
    }

    // Crosshair.
    final double cx = slot * cross + slot / 2;
    final double cy = yOf(candles[cross][3]);
    final Paint ch = Paint()
      ..color = const Color(0xFFEAECEF).withValues(alpha: 0.6)
      ..strokeWidth = 1;
    _dashV(canvas, cx, 0, priceH, ch);
    _dashH(canvas, 0, size.width, cy, ch);
    canvas.drawCircle(
        Offset(cx, cy), 3.5, Paint()..color = const Color(0xFFEAECEF));
  }

  void _dashV(Canvas c, double x, double y0, double y1, Paint p) {
    double y = y0;
    while (y < y1) {
      c.drawLine(Offset(x, y), Offset(x, y + 4), p);
      y += 8;
    }
  }

  void _dashH(Canvas c, double x0, double x1, double y, Paint p) {
    double x = x0;
    while (x < x1) {
      c.drawLine(Offset(x, y), Offset(x + 4, y), p);
      x += 8;
    }
  }

  @override
  bool shouldRepaint(_FullCandlePainter oldDelegate) =>
      oldDelegate.candles != candles ||
      oldDelegate.showMa != showMa ||
      oldDelegate.showVol != showVol ||
      oldDelegate.cross != cross;
}
Plus bundled 1 binary asset (fonts/images). The CLI and MCP install those for you automatically.
Two faster ways to add it
Copy-paste works, but you can skip it entirely.
1. FlutterKit CLI
One command drops this screen — and its fonts — straight into your project.
$ flutterkit add web3-coin-chart-fullscreen2. AI agent (MCP)
Connect FlutterKit's MCP server in Claude or Cursor and just ask your agent to install web3-coin-chart-fullscreen — it fetches and writes the files for you.
FAQ
Can I ship this fullscreen chart in a paid or commercial app?
Yes. It is free for personal and commercial projects: copy the file from this page, add it with the CLI command, or fetch it over MCP. You do not need a licence key, an account, or an attribution line.
Does the chart rely on any packages or custom fonts?
No third-party packages — candles, gridlines, axis labels, the moving average and the crosshair are all drawn by `_FullCandlePainter` on a plain Flutter canvas, with axis text rendered through `TextPainter`. The only asset is the bundled Inter font named in `fontFamily`, which the painter's labels use too.
What Flutter version do I need?
Flutter 3.22 or later, since the chip fill, gridlines, volume bars and crosshair all call `Color.withValues(alpha: ...)`. On an older SDK, swap each one for `withOpacity(...)` with the same value, and rewrite the `super.key` constructor parameter as `{Key? key, ...} : super(key: key)`.
Can users drag to scrub the crosshair instead of tapping?
Yes, with a small change. Move the slot maths into a helper and call it from both `onTapDown` and `onHorizontalDragUpdate`, which supplies `localPosition` the same way. While you are there, wrap the chart in a `LayoutBuilder` and divide `constraints.maxWidth` by the candle count, so the mapping uses the chart's own width rather than the screen's `context.size`.
Does this screen rotate the phone into landscape?
No. Despite the fullscreen name it is a portrait `Column`; the effect comes from the `Expanded` chart taking all free height. To force landscape, call `SystemChrome.setPreferredOrientations` with the landscape values in `initState` and restore portrait in `dispose`. Every painter coordinate is proportional, so the chart widens cleanly — but use the `LayoutBuilder` fix above, because landscape `SafeArea` insets make screen width and chart width differ.


